口座開設は無料。オンラインで簡単にお申し込みいただけます。
最短3分で入力完了!
Chief Investment Strategist
サマリー: 2023年の株式のパフォーマンスだが、グローバル全体では好調に推移し、中でもインド株式はベスト・パフォーマーのひとつとなった。中国は投資家を失望させ、その株式は他の市場を下回っている。新興市場も期待外れで、そのリターン期待は先進市場ほど高くない。インドは今後、中国を上回る成長が期待されるが、その成長率は期待されるほどではないだろう。
今年は、2022年末の予想が外れ、様々な意味で注目すべき年となった。中国は市場が期待したほどの成長回復を遂げなかった。世界経済は予想に反して、景気後退に陥らなかった。インフレ率は予想以上に高止まりし、「長期的に上昇」というシナリオの下、政策金利は引き上げられた。銀行危機は一時的に株価の変動要因となったが、リスク管理が不十分な少数の銀行の問題であると証明された。生成AI技術もテクノロジー株、そしてより広範なセンチメントに変化をもたらした。
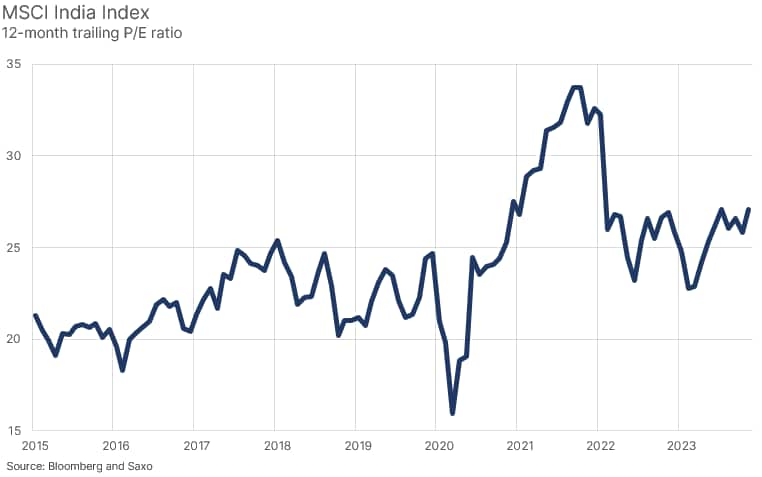
私たちは2023年に「分断化ゲーム」を大々的に書いたが、これは自立的な原則の下での現在の地政学的ダイナミズムを説明する概念である。このダイナミズムは中国には不利で、メキシコ、インド、ベトナム、インドネシア、韓国、日本など他の国には有利である。この基本的なトレンドは市場にも理解されており、インド株は米ドルベースで19.3%上昇し、今年最も好調な市場のひとつとなっている。これに対し、中国株は12.8%減、先進国市場は23.1%増、米国株は26.5%増、欧州株は18.7%増である。この上昇の大半は、利益成長がごくわずかであったためにPERが上昇したことによるもので、2024年は企業が市場価値を正当化するために利益成長を実現しなければならない年になる。
インドについて重要なことは、経済成長率が当面中国を上回ると予測され、アップルに続いて多くの企業がインドで生産を開始することである。また、インドは来年4月に選挙を控えており、新政権が新たな成長イニシアチブを開始する可能性が高いため、センチメントと成長にとってプラス要因となる可能性がある。しかし、インドの将来的な成長は決して安くはない。

出典: ブルームバーグ、Saxo
多くのグローバル投資家にとって中国は、米中貿易摩擦、ウクライナ戦争、規制強化、資本規制、人口減少、そして最近では明らかに破綻した経済モデルにより、ますます投資対象から外れている。上図が示すように、2018年1月1日以降の中国株の米ドルベースの累積リターンは、同期間の世界株の66%、米国株の92%に対し、マイナス31%となっている。
2022年後半に中国の厳格なロックダウンが解除された後、市場は2023年に中国が力強い回復を遂げることに懸命に賭けていたが、不動産セクターの度重なるトラブルがその夢を狂わせた。その代わり、中国は弱体化からさらなる弱体化へと転じ、政府はさらなる景気刺激策を打ち出して今年を終えた。その意図は良いが、問題は、輸出主導で他国にシェアを奪われているときに、たるみの多い経済をどのように刺激するかということだ。現時点では非生産的な資本の使い方であるため、景気刺激を不動産に向けることはできない。2024年の中国に簡単な解決策はない。
新興市場はここ10年以上期待外れで、米国株式市場のリターンが好調なため、世界の投資家はますます新興市場のストーリーを無視し、米国のテクノロジー・セクターに賭けるようになっている。2024年の主な課題は、新興市場が最終的に軌道に乗るかどうかである。これには2つの見方がある。
1)超短期的には、新興国株式市場のアウトパフォー マンスは、中国株のリバウンド・ケースに直結する。もしそれが実現しなければ、新興国株は再びアンダーパフォームするだろう。
2)長期的(10年)には、資本消費とGDP成長率の収益成長率への影響力の低さから、新興国株は先進国株ほど魅力的ではなさそうだ。
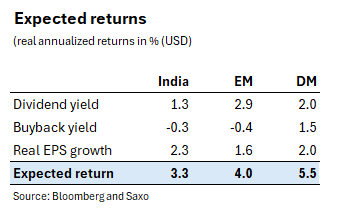
インド株、新興国、先進国株とその10年実質リターン予想(米ドル建て)を見てみよう。下図が示すように、配当利回りはインドでは非常に低く、新興国でははるかに高い。配当利回りは株式の長期リターン期待の出発点である。企業は配当だけでなく、自社株買いでも資本を還元することができる。インド株と新興国株を見ると、2015年初頭以降、企業は資本を消費している(自社株買いによる普通株の減少よりも普通株の発行が多い)。先進国株では、過剰資本利益率は平均して年率1.5%の自社株買い利回りを達成している。
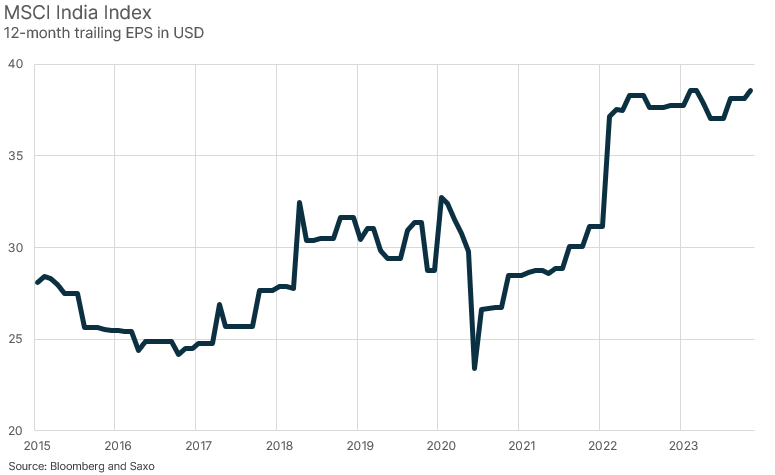
最後に、ここが重要なポイントだが、インドの上場企業は米ドル建てで年率4.7%程度の利益成長しか達成していないため、インド株は米ドル建てで大幅な実質利益成長は期待できない。米国の10年間のインフレ率予想(年率2.4%)を差し引くと、米ドル建ての実質利益成長率は年率2.3%にすぎない。実質GDPの年間成長率は6.9%前後なのに、なぜこれほど低いのか。この背景には、1)インド・ルピーが平均で年率3.5%程度下落する(インドルピーと米ドルのインフレ率の差による)、2)GDP成長率と利益成長率の間の伝達率が低い、などいくつかの要因がある。それは
米ドルベースの新興国の収益成長は、中国の収益が原因でさらに期待外れとなっている。米ドルベースの実質収益成長率は2015年初頭以来ゼロに近い。この背景には、コモディティ市場の低迷、米ドル高、中国企業部門の収益低迷、構造的な成長難など、いくつかの要因がある。今後10年間は米ドル安が進み、コモディティは上昇を続けると予想されることから、米ドルの実質利益成長率は過去8年間よりも高くなると予想し、年率1.6%と先進国を下回る予想とした。

出典: ブルームバーグ、Saxo

出典: ブルームバーグ、Saxo

出典: ブルームバーグ、Saxo
A strong 2023 for India and global equities
This year has been remarkable in many ways with year-end 2022 predictions not coming true. China did not deliver the growth rebound expected by the market. The global economy did not slip into a recession as expected. Inflation remained stickier than expected lifting policy rates under the narrative “higher for longer”. A banking crisis was close to fulfil many negative predictions but proved to be isolated among a few bank banks with poor risk controls. The generative AI technology also proved to be a game changer for technology stocks and more broadly sentiment.
We wrote extensively from the fragmentation game in 2023 which is concept that describes the current geopolitical dynamic under a self-reliant principles. This dynamic is bad for China and good for other countries such as Mexico, India, Vietnam, Indonesia, South Korea and Japan. This underlying trend is understood by the market and Indian equities have also been one of the best performing markets this year up 19.3% in USD terms. For comparison, Chinese equities are down 12.8%, developed markets up 23.1%, US equities up 26.5% and European equities up 18.7%. Most of the rise this has been due to P/E ratios rising as earnings growth has been miniscule which sets 2024 up for a year where companies must deliver on earnings growth to justify their market values.
An important to note on India is that economic growth is now projected to outstrip China for the foreseeable future and many more companies will follow Apple setting up manufacturing in the country. India is also having an election in April next year and this could become a positive factor for sentiment and growth as the new government will likely initiate new growth initiatives. But the future growth of India does not come cheap as we explain further down.
For many global investors China has increasingly become uninvestable due to trade frictions between the US and China, the war in Ukraine, increased regulations, capital controls, declining population, and lately an obvious broken economic model. As the figure above shows, Chinese equities have delivered -31% cumulative return in USD terms since 1 January 2018 compared to 66% for global equities and 92% for US equities over the same period.
After the strict lockdowns in China were lifted in late 2022 the market was betting hard on China to deliver a strong rebound in 2023, but the recurring troubles in the real estate sector derailed your dreams. Instead China from weakness to more weakness ending this year with communicated intentions by the government to stimulate the economy even more. While those intentions are good the question is how you stimulate an economy with a lot of slack when it is export driven and losing market share to other countries. Stimulus cannot be directed to real estate because this is an unproductive use of capital at this point. There are no easy solutions for China in 2024.
Emerging markets have been a disappointment for over a decade now and with strong US equity market returns global investors have increasingly ignored the emerging market story betting on the US technology sector. The main question for 2024 is whether emerging markets can finally get back on track. There are two ways to look at this.
Let us look at Indian equities, EM and DM equities and their 10-year real return expectations in USD. As the figure below shows, the dividend yield is very low in India and much higher in EM. The dividend yield is the starting point for setting long-term return expectations in equities. Companies can return capital through dividends but also buybacks. If we look at Indian and EM equities then we observe that since early 2015 companies have consumed capital (issued more common stock capital than decreased common stock through buybacks), which is not necessarily bad if that issued equity capital is used for enabling higher growth rates. In DM equities excess return on capital has on average delivered 1.5% annualised buyback yield.
Finally, and this is the important point, Indian equities are not expected to deliver a significant real earnings growth in USD as Indian publicly listed companies have only grown earnings in USD by around 4.7% per year. If we subtract the 10-year inflation rate expectation in the US of 2.4% annualised then the real earnings growth in USD is only 2.3% annualised. How can it be so low when annual real GDP growth has been around 6.9%. There are several factors behind this such as 1) the Indian Rupee declines on average around 3.5% annualised due to the inflation differential between INR and USD and 2) low transmission between GDP growth and earnings growth. It
Earnings growth in EM in USD terms has been even more disappointing because of Chinese earnings. The real earnings growth in USD has been close to zero since early 2015. There are several factors behind this such as weak commodity markets, stronger USD, weak Chinese corporate sector earnings, and structural growth difficulties. Given we expect the USD to weaken over the next 10 years and commodities will continue to rise we expect real earnings growth in USD can be higher than what it has been over the past 8 years and thus we set expectations below DM at 1.6% annualised.