口座開設は無料。オンラインで簡単にお申し込みいただけます。
最短3分で入力完了!
最高投資ストラテジスト(Saxo Group)
サマリー: 米国債券市場は歴史的な出来事に見舞われており、株式への下落圧力など、市場全体に波及効果をもたらしている。問題は、こうした米国長期債利回りの急上昇が市場の「マイク・タイソン・モーメント」なのかどうかだ。市場は債券利回りの新たな均衡を確立しようとしているようだが、問題はそれが何かを壊さずにできるかどうかだ。投資家はリスクの軽減に留意し、検討すべきである。
※本レポート内日本語は、ご参考情報として原文(英語)を機械翻訳したものです。
当社のCIO、スティーン・ヤコブセンが今日のマクロ・ノートで書いているように、市場は「マイク・タイソン・モーメント」を迎えている。興味深いことに、SOFR先物(将来のFRBの政策金利の値付けに使われる金融商品)はかなり安定しており、長期金利上昇のシナリオを示唆している。市場は基本的に、インフレが上振れするリスクを補うために、インフレ・スワップに織り込まれたインフレ期待に対する相応のリスク・プレミアムを求めている。
米10年債利回りのこの動きがどれほど大きいかを知るために、平均残存期間7.5年の米国債インデックスをみてみましょう。ドローダウンは日次で18.4%、月次で17.8%である。現在のドローダウンは、1972年以降で2番目に大きいドローダウン(1979年7月から1980年2月までのドローダウン7.4%)の2.5倍である。ドローダウンの長さに関しては、現在のドローダウンは39ヵ月であり、2016年8月から2019年3月までの金利上昇局面における32ヵ月という過去の記録よりも長い。言い換えれば、今日の債券市場で目撃されていることはユニークであり、このような異常値であるため、何かが壊れる原因となるだろう。


米国債インデックスの下落率|出所:Bloomberg and Saxo
iシェアーズ7-10年債ETFのビッド・アスク・スプレッドもここ数年着実に上昇している。2018年のクリスマス休暇前後の政策ミスやコロナ禍の混乱期のようなパニックモードは見られない。しかし、スプレッドが着実に上昇していることは、マーケットメーカーが米国債市場で認識しているリスクが高まっていることを示唆している。何かが壊れるポイントへの道を歩んでいるのかもしれない。

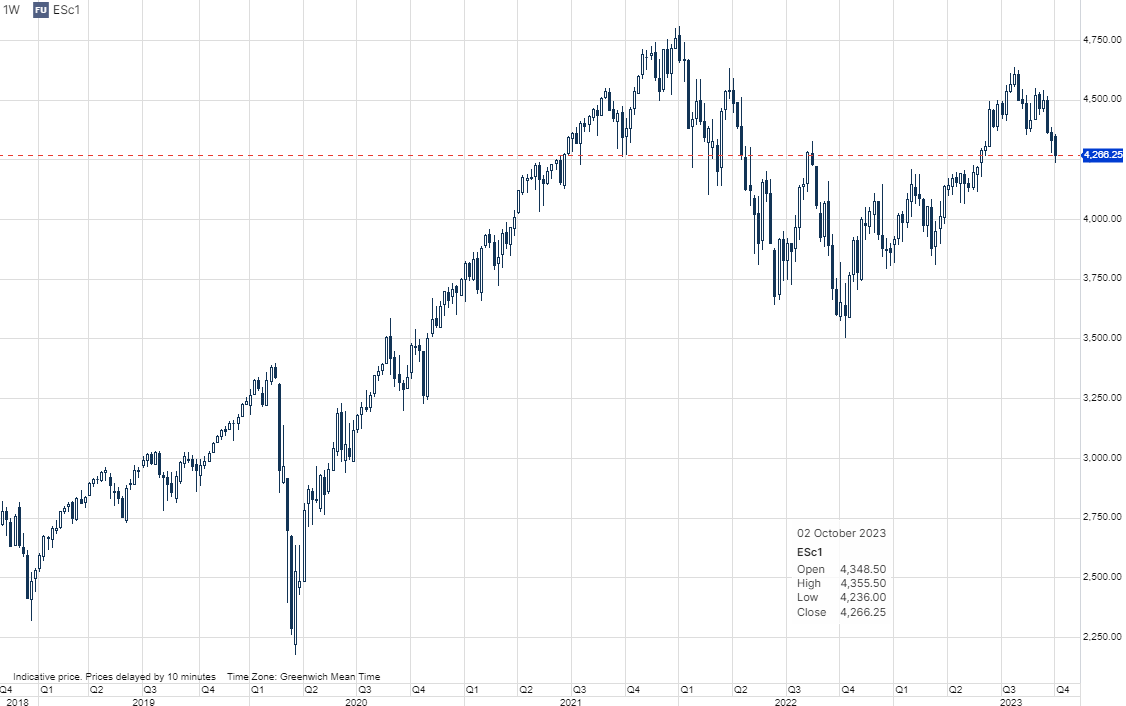
S&P500先物は7月の高値から8%下落しているが、米国債利回りが日中の高値からやや低下しているため、今日(10月4日時点)の取引ではやや回復している。金利が上昇すればするほど、株式への評価もより大きな影響を受けるため、株式は当然ながら金利上昇の影響を受ける。資本コストのデルタは、キャッシュフローの成長デルタよりも高い。
ボラティリティを見ると、VIX指数自体はまだパニック・モードに移行していない。VIX先物のフォワード・カーブは、コンタンゴ(上昇傾斜)の状態が最も長く続いた後、最近ではかなりフラットになっている。今朝(10月4日時点)のように、VIX先物曲線がバックワーデーションに少し動いても、それは致命的なことではない。カーブが大きく逆行する場合は、カーブの前部でパニック・ヘッジが発生したことを示すため、重要である。VIX指数がまだパニック・モードに移行していないということは、市場にはまだ下振れリスクが残っていることを示唆している。

S&P500連続先物|出所:Saxo

より長い時間軸を持ち、市場に対してあまり積極的でない多くの投資家にとって、考慮すべき重要な点は以下の通りである:
現金: キャッシュ・エクスポージャーについては、2つの考え方がある。1) 既存のポジションを売却してキャッシュ・エクスポージャーを増やすか、2) 投資を中止して余剰貯蓄を現金に換え、市場に追加投資する前に辛抱強く待つ。投資家は一般的に、オール現金化はタイミング・リスクが高まるので避けるべきである。私は個人的に、現金一辺倒は良くないということを証明する傷を負っている。現金50%にすることは、歴史的な観点から見ると、まだ非常に守りの姿勢であり、投資していることの良い点は、市場リスクを再び高めることが心理的にはるかに容易であるということである。
分散投資: 多くの個人投資家は集中ポートフォリオを組んでいるため、市場リスクが上昇した場合には集中リスクを減らすことが重要である。一つの選択肢は、上位の保有銘柄を減らし、世界中の株式市場を追跡するETFにエクスポージャーを移すことである。これは、長期投資を希望し、分散を高めたい場合には理にかなっている。集中リスクには様々な形がある。8銘柄を保有しているが、すべてテクノロジー株の場合、分散投資をしているつもりでも、実際には小さなリスクにさらされていることになる。そのため、投資家は単一の業種に偏り過ぎないように注意する必要がある。
ディフェンシブかシクリカルか: 8月に書いたように、スタグフレーションのリスクが高まっており、景気循環セクターの危険性も高まっている。歴史的に見て、スタグフレーションのようなシナリオは、テクノロジー、金融、不動産にとって最悪である。公益事業、エネルギー、消費者関連商品、ヘルスケアなどのディフェンシブ・セクターは、通常、景気後退時にはるかに良い結果を出す。したがって、投資家は景気循環セクター、特にテクノロジー株へのエクスポージャーを避けなければならない。
メガ・キャップは避けよう: 今年の大きなテーマはAIであった。AIは米国のメガ・キャップ株を膨張させ、等加重(イコール・ウェイト)の米国株指数と時価総額加重の指数との間にパフォーマンスの差が出るほどになっている。これはこれら大型株のアウトパフォームを反映したもので、テクノロジーに対するセンチメントが変化すれば、すぐに変わる可能性がある。
Summary: The US bond market is undergoing a historic event creating knock-on effects across markets including downward pressure on equities. The question is whether these rapidly rising US long end bond yields are the "Mike Tyson moment" of markets. It seems the market is trying to establish a new equilibrium in bond yields but the question is whether it can be done without breaking something. Investors should take note and consider reducing risks which can be done in different ways which we explain.
Equity investors should consider reducing their portfolio risk. This can be done by raising the cash exposure by selling existing positions, or increasing diversification if the intention is to remain fully invested. We also argue that investors should avoid technology stocks.
We link to previous research notes on hedging market risks and what options are available for traders and investors.
The market is having its “Mike Tyson moment” as our CIO Steen Jacobsen writes in his macro note today with the long end of the US yield curve galloping higher. Interestingly enough, SOFR futures (instruments using to price the Fed’s policy rate in the future) are rather stable suggesting a higher for longer narrative playing out, but also a steeper yield curve reflecting the market’s unease with the US political and fiscal situation. The market basically wants a decent risk premium over inflation expectations priced in inflation swaps to compensate for the risk of inflation surprising to the upside.
To get a sense of how big this move in the US 10-year yield is take a long a the US Treasury Index which has an average maturity of 7.5 years. The drawdown is now 18.4% using daily observations and 17.8% using monthly observations. The current drawdown is 2.5 times the second largest drawdown since 1972 which was the drawdown of 7.4% from July 1979 to February 1980. In terms of length the current drawdown is 39 months which is also longer than the previous record of 32 months during the rising rates environment from August 2016 to March 2019. In other words, what we are witnessing in bond markets today is unique and because the move being such as outlier it will cause something to break.
Bid-ask spreads on the iShares 7-10 Year Treasury Bond ETF have also steadily been rising for years. We are not seeing panic mode like during the policy mistake around the Christmas holiday of 2018 and the chaotic days of the Covid pandemic, but the steadily rising spreads suggest perceived risks by market makers in the Treasury market are going up. We could be on a path to a point where something really breaks.
S&P 500 futures are down 8% from their highs back in July but have recovered somewhat in today’s trading session as US bond yields are coming down a bit from their intraday highs. Equities are naturally getting impacted with higher interest rates as every move higher from here leads to a larger and larger impact on equity valuations through the cost of capital delta is higher than the delta on growth on cash flows.
If take a look at volatility the VIX Index itself has not yet switched to panic mode. The VIX futures forward curve has flattened a lot recently after one of the longest periods of being in contango (upward sloping). If the VIX futures curve moves a bit into backwardation, as it did this morning, it is not critical. It becomes critical if the VIX forward curve inverts a lot because it signals panic hedging in the front part of the curve. The fact that the VIX has not switched to panic mode yet suggests that there is still downside risks to markets as these bigger moves in markets never stop until something breaks and the VIX forward curve shows that nothing has broken yet.
Are the options for the investor?
The first thing to acknowledge is that there is not one option that fits all investors. We all have different time horizons, return objectives, saving profiles and risk attitudes. The different options available to investors can be categorized into two groups: simple and advanced strategies. The more advanced hedging strategies involve options and futures which are covered in Steen’s macro note and in some of the various notes we have written before on hedging (see links in the next section).
For many investors with a longer time horizon and a less active approach to the market some of the key things to consider are the following:
What have we written in the past on managing risk?
Below we have listed previous notes we have written on hedging market risk which can be done in many different ways. Above we explained some simple things and the more advanced strategies are presented below.
Hedging – a guide to reducing portfolio risk by Peter Siks. Explains hedging using futures.
Investing with Options: Hedging your Portfolio by Koen Hoorelbeke. Explains out-of-the-money put options and VIX call options.
What are the different strategies to hedge your portfolio? By Peter Garnry. Explains hedging using cash, diversification, shorting using CFDs and futures, long put options, and long volatility using VIX futures.
How to use protective put and covered call options by Gary Delany. Explains how to use two simple options strategies change the risk profile of a position.
Recession Watch: Is gold really a safe hedge? By Ole Hansen. Explains why gold has often been a good hedge during recessions.